
The Week Ahead: Range Bound Volatility
India & Global Macro: Nifty, Sector Indices, S&P 500, Gold, Crude, Stocks


The week ahead, broken down in 11 charts — where the markets stand, what the charts are signaling, and the levels that matter most.
Top Indices
1. Nifty: 24,206 (-0.26%)
The index is facing strong resistance around the April ‘26 weekly high near the 24,500 level.
Intra-week upswings are facing selling pressure around the weekly swing high.
Last week’s decline found support at the 50 DMA at 23,829.
A break below the 50 DMA could trigger a short term downswing.
Support is around 23,829.
Expect intra-week volatile swings within the 24,400 to 23,800 range.
Nifty Daily Chart
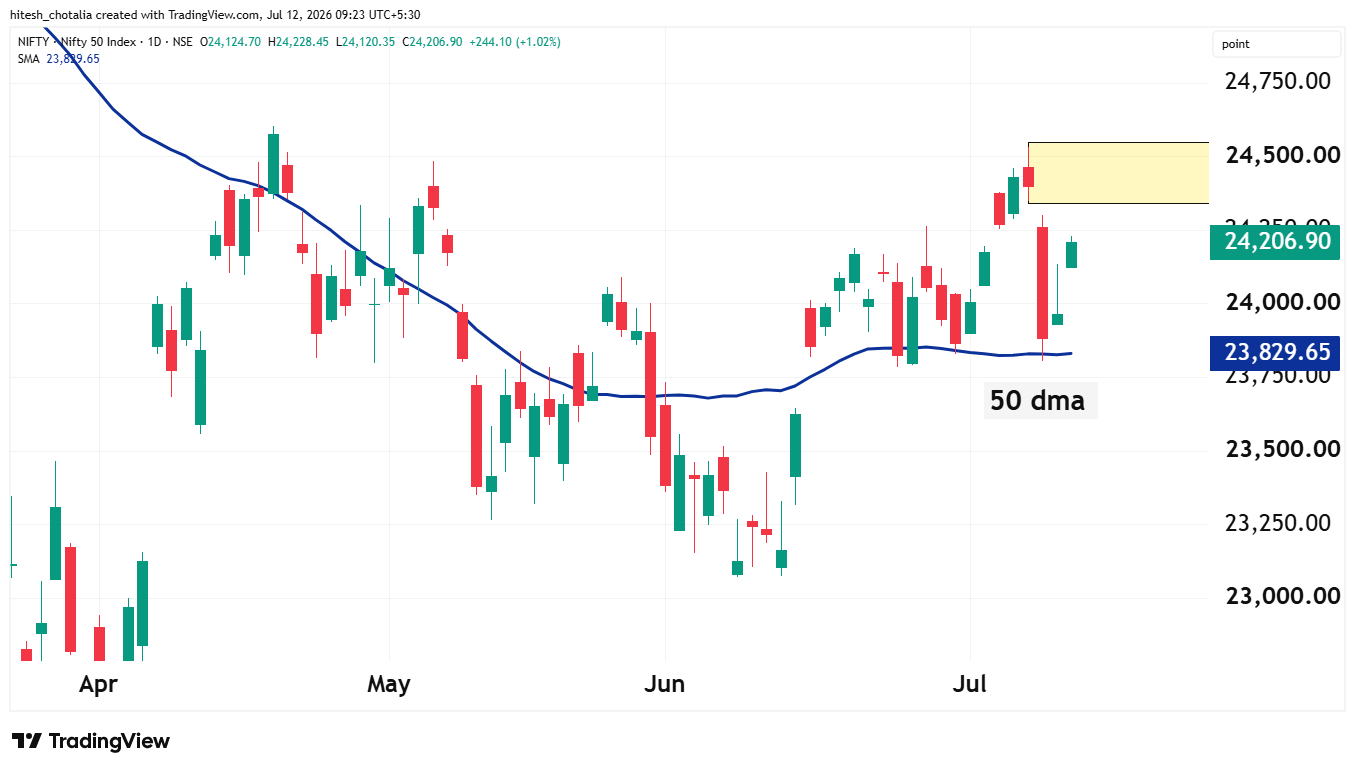
Chart Source: TradingView
Weekly Support: 24,031 - 23,829 - 23,651
Weekly Resistance: 24,348 - 24,530 - 24,600
2. Bank Nifty: 58,045 (+0.19%)
The index has been in consolidation for the last four weeks.
The consolidation band is 56,549 to 58,706.
Intra-week volatility is seen within the consolidation band.
The index is whipsawing around the 200 DMA at 57,290, suggesting volatility will continue.
A break below the 200 DMA could trigger a downswing.
Expect range bound intra-week volatility.
Bank Nifty Weekly Chart
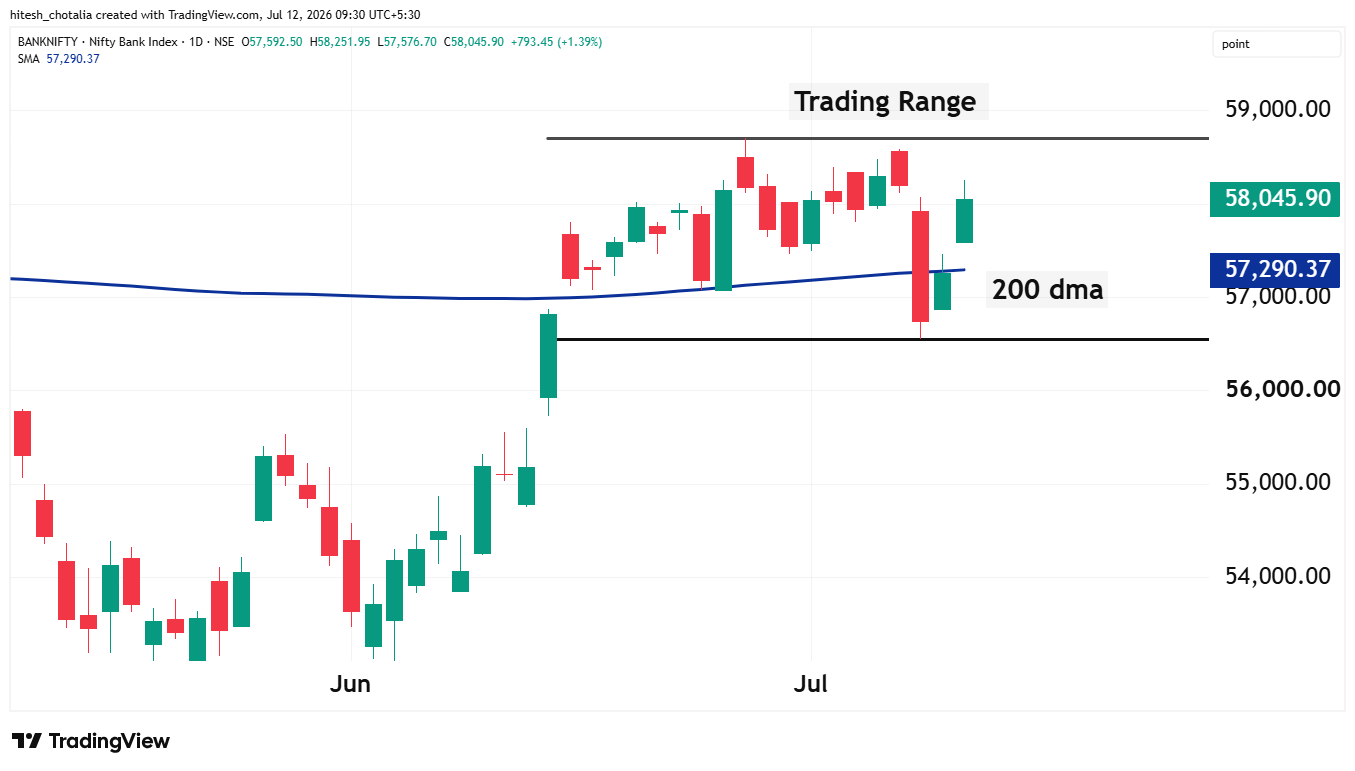
Chart Source: TradingView
Weekly Support: 57,577 - 57,290 - 56,549
Weekly Resistance: 58,581 - 58,706 - 59,200
3. Nifty MidCap 100: 63,036 (+1.36%)
The index is in an uptrend, forming a sequence of higher lows and higher highs.
The index has closed above its previous all time high of 62,907.
On the daily chart, the index has broken out from a bullish flag.
Short term support is around 62,313.
Lower support is around 61,500.
Expect the upswing to continue with intra-week dips.
Nifty MidCap 100 Daily Chart
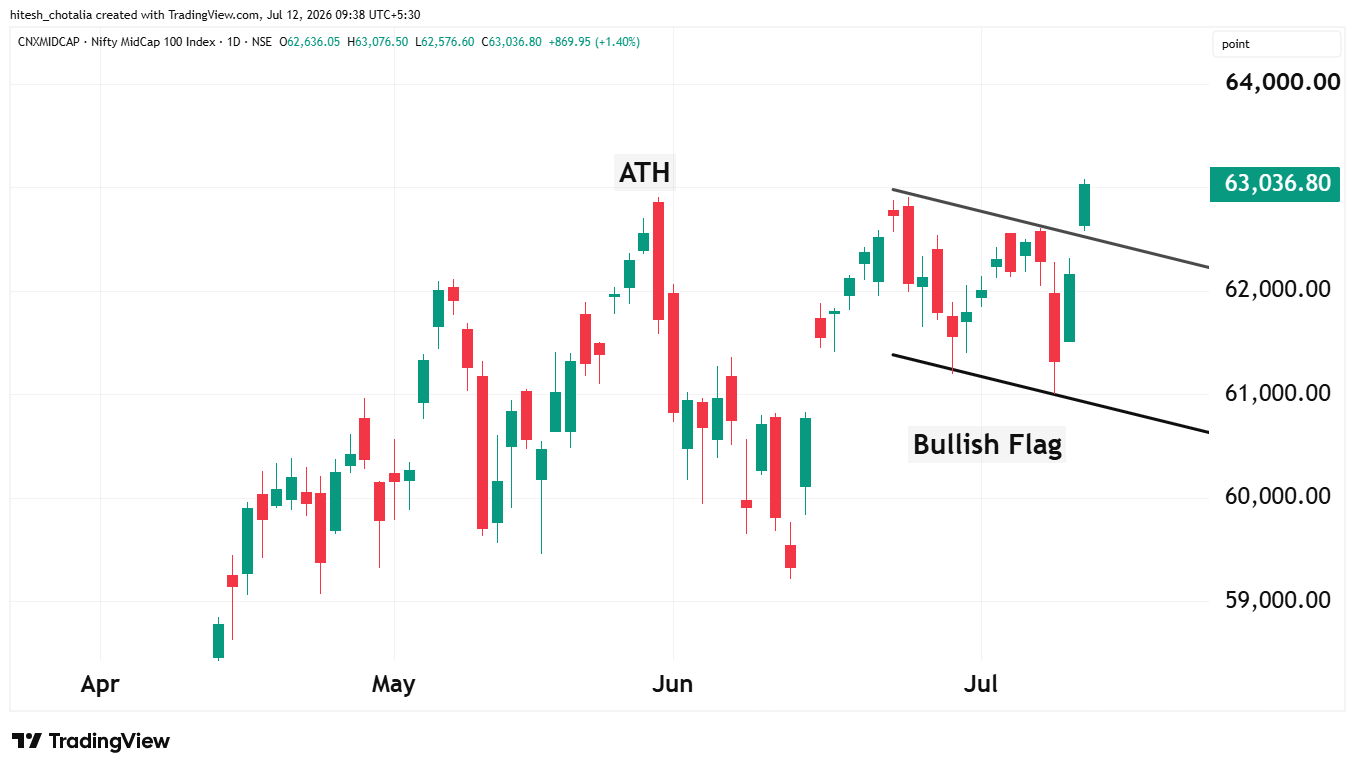
Chart Source: TradingView
Weekly Support: 62,313 - 61,500 - 61,044
Weekly Resistance: 63,067 (ATH)
4. Nifty Auto Index: 26,860 (-0.47%)
The index has been in medium term consolidation for the last thirteen weeks.
The established trading range is 25,400 on the downside and 27,500 on the upside.
Upswings are facing stiff resistance around 27,500.
The index is whipsawing around the 200 DMA at 26,852, suggesting intra-week volatility will continue.
A breakout above 27,500 could trigger a trending move on the upside.
Support is around the last swing low, in the range of 26,067 to 26,500.
Expect range bound consolidation to continue, with support around 26,067 to 26,500.
Nifty Auto Index Daily Chart
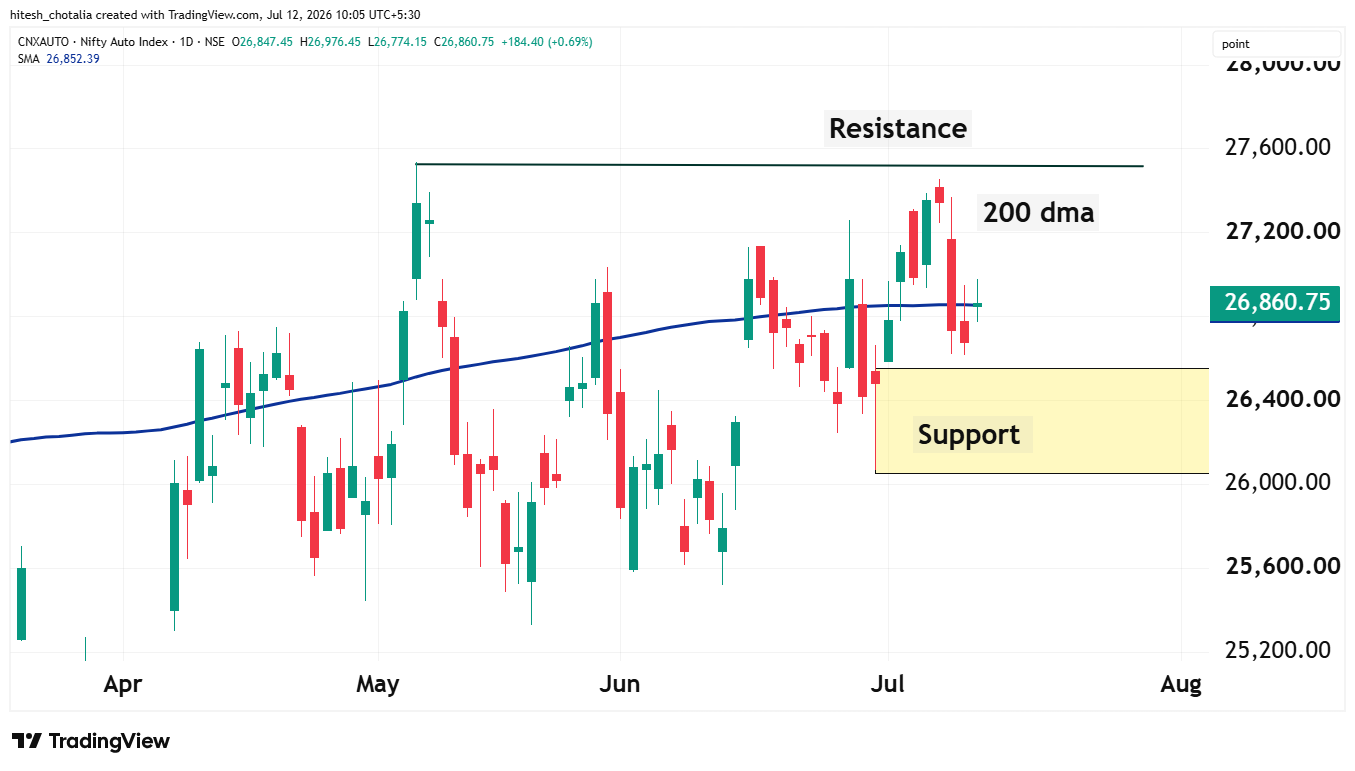
Chart Source: TradingView
Weekly Support: 26,744 - 26,500 - 26,067
Weekly Resistance: 26,976 - 27,206 - 27,500
5. Nifty IT Index: 28,010 (+2.08%)
The index continues its downswing on higher timeframe charts, forming a sequence of lower highs and lower lows.
Intra-week pullbacks are seen from oversold levels.
Last week’s pullback met resistance around the swing high zone.
Resistance is around the swing high zone, in the range of 28,338 to 29,007.
Support is around the 20 DMA at 27,521; a break below could see the downswing resume.
Lower support is around 26,000.
Expect strong resistance around 28,338 to 29,007.
Nifty IT Index Daily Chart
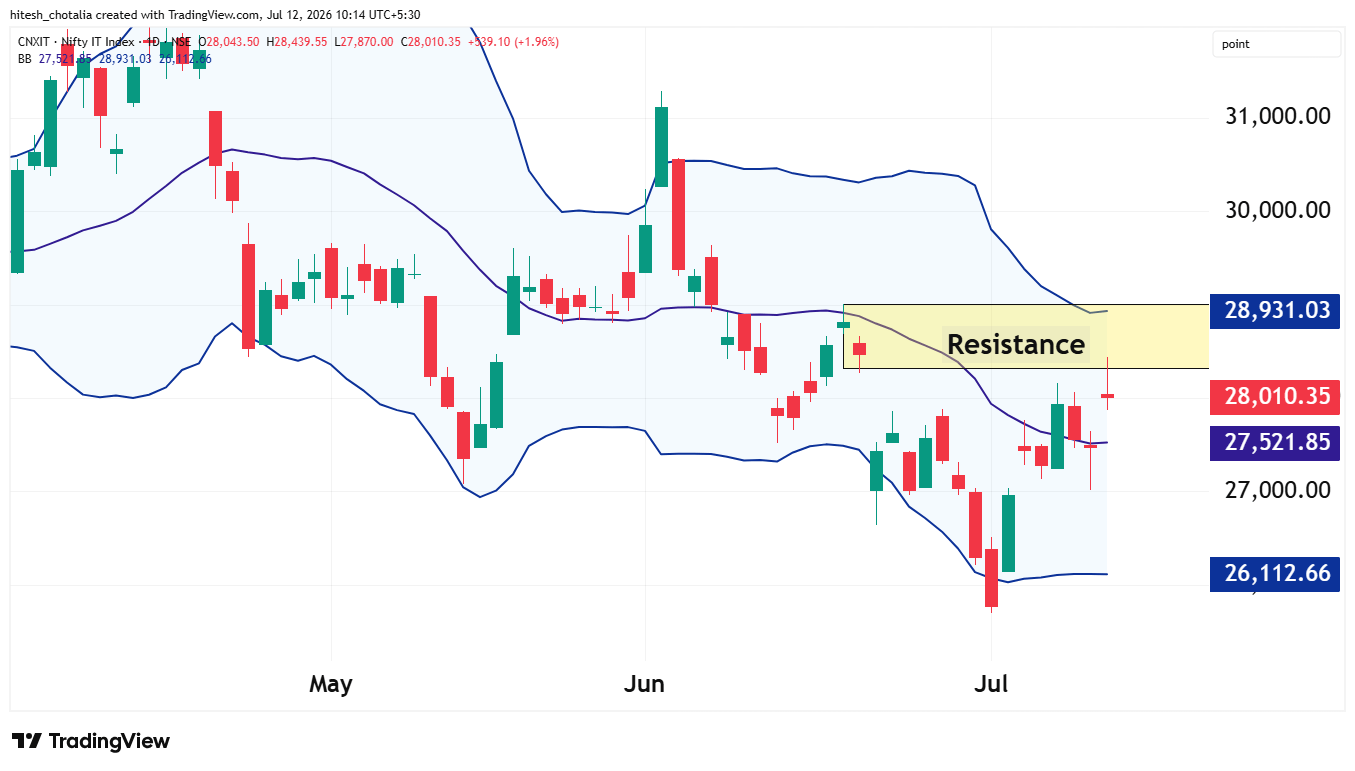
Chart Source: TradingView
Weekly Support: 27,521 - 27,014 - 26,000
Weekly Resistance: 28,304 - 28,338 - 29,007
6. Nifty Pharma Index: 25,674 (-0.28%)
The index is in a long term and medium term uptrend.
In the short term, prices are trading sideways within a defined range of 25,308 to 26,022.
A breakout from this range could trigger a short term trending move.
Lower support is at 25,000.
The upswing is expected to continue above 26,022.
Nifty Pharma Index Daily Chart
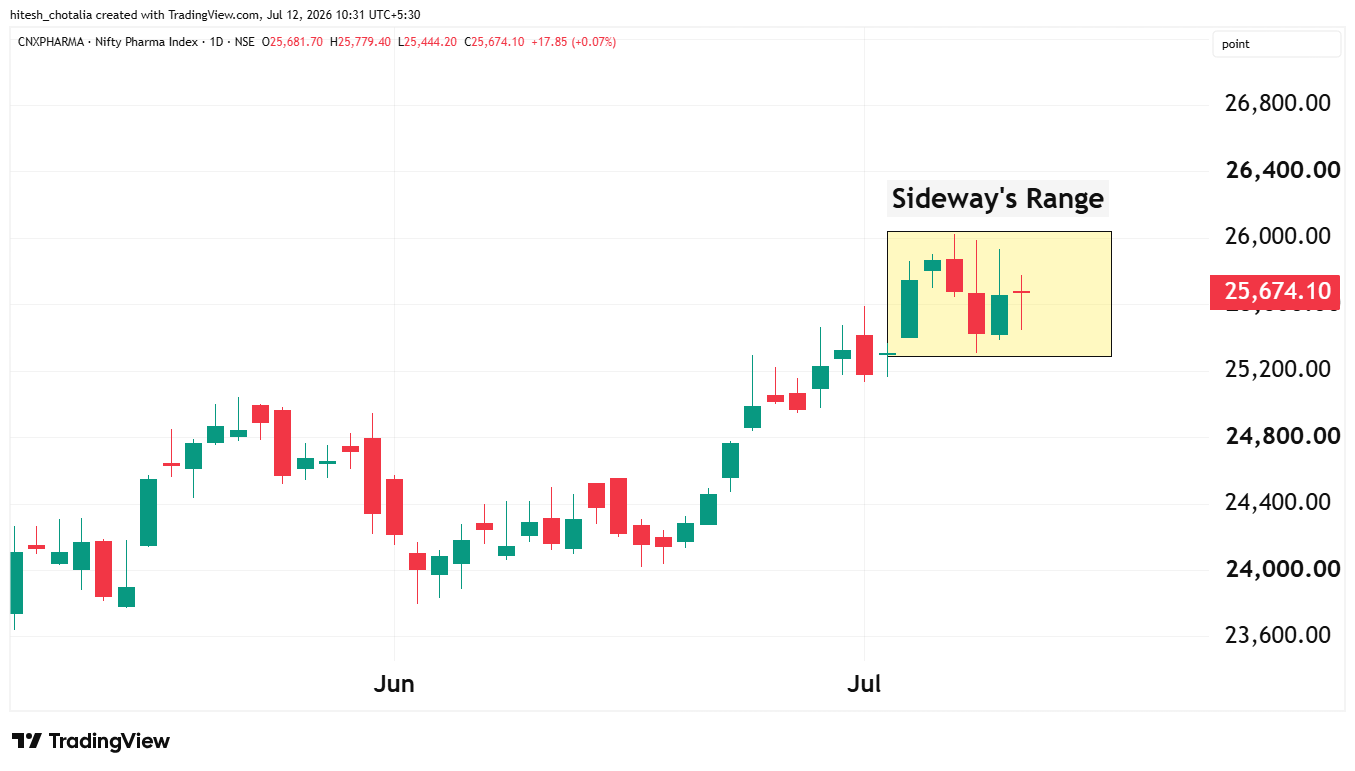
Chart Source: TradingView
Weekly Support: 25,308 - 25,000 - 24,948
Weekly Resistance: 25,842 - 25,935 - 26,022
7. S&P 500: 7,575 (+1.23%)
The index is trading near its all time high of 7,620.
The index has broken out from a triangle pattern.
Sustaining above 7,500 could see the upswing continue toward 7,600.
Resistance is around 7,620.
Support is around 7,500.
Lower support is around 7,452.
Expect the upswing to continue toward 7,600.
S&P 500 Daily Chart
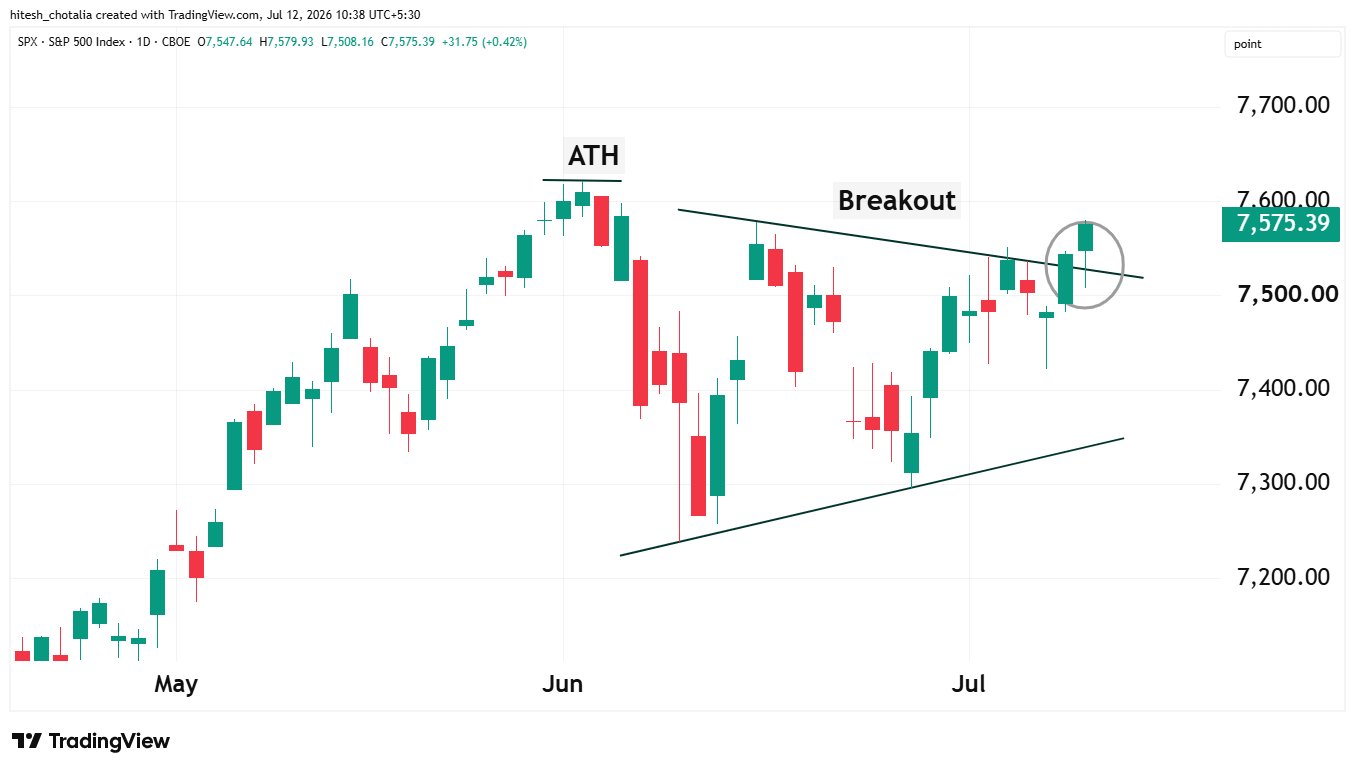
Chart Source: TradingView
Commodities
8. Gold Comex: 4,113 (-0.29%)
Gold prices are seeing a short term pullback from oversold territory.
The pullback follows a positive divergence on the RSI.
The short term swing is up, with a support base around 4,032.
Resistance is around 4,244.
Expect the short term upswing to continue.
Gold Comex Futures Daily Chart
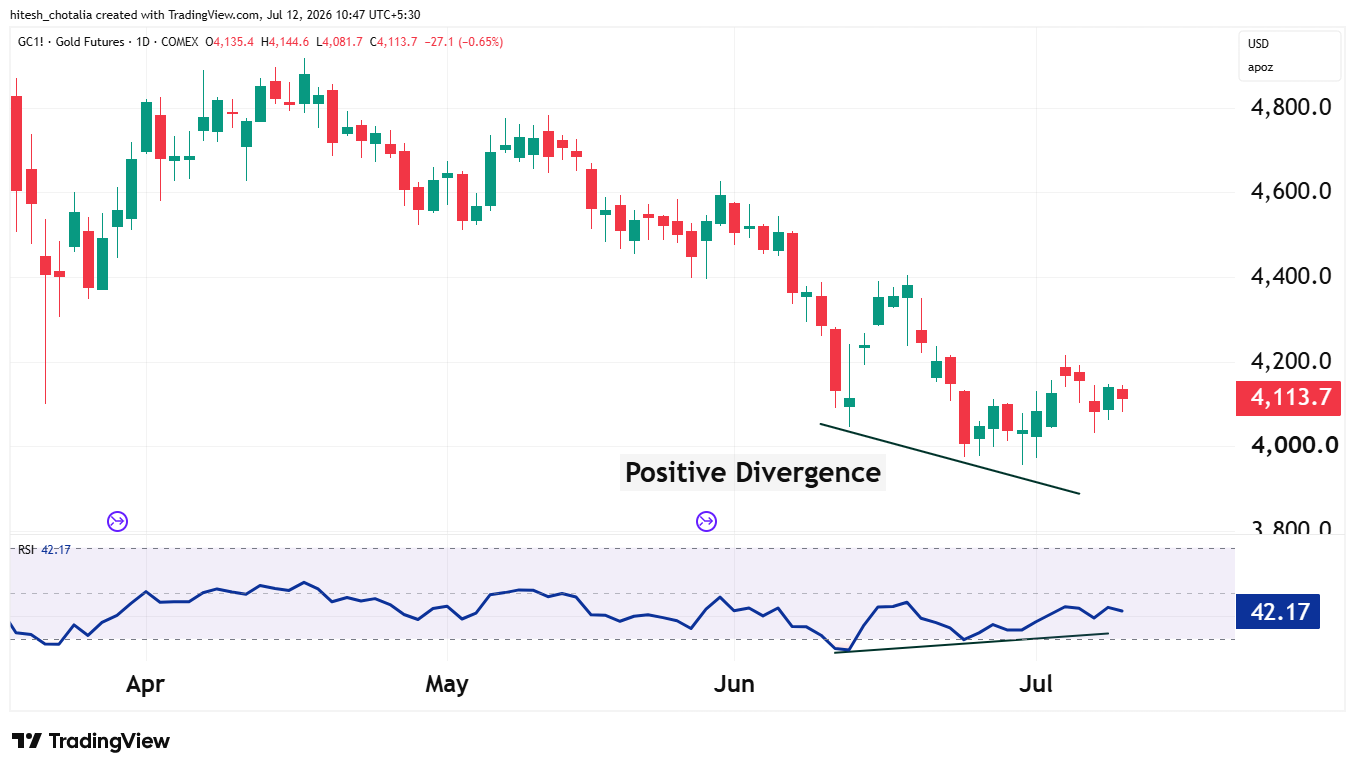
Chart Source: TradingView
9. Crude Nymex: 71.41 (+3.96%)
Crude prices are in a short and medium term downswing.
On the daily chart, prices are seeing a short term upward spike from an oversold RSI reading.
The pullback is facing resistance around the middle Bollinger Band, near 74.
Support is around 66 to 68.
Upside resistance is around 74 to 78.
Expect a test of support around 66.
Crude Nymex Futures Daily Chart
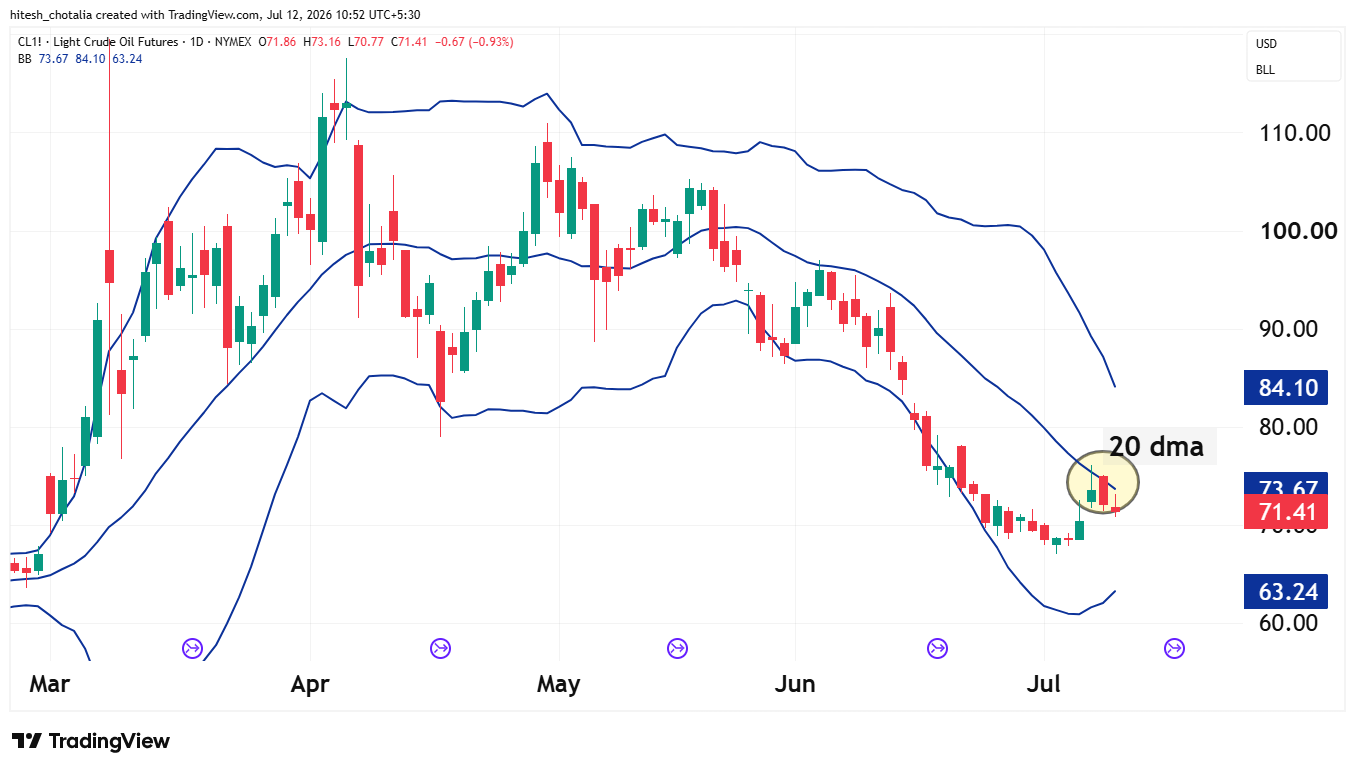
Chart Source: TradingView
Stocks in Spotlight
10. L&T: 3,945 (-2.01%)
Prices are in medium term consolidation.
Prices are currently trading near the lower end of the consolidation band, around 3,800.
On the daily chart, prices are oversold near the lower Bollinger Band.
Resistance on the upside is around 4,096.
Expect support around 3,800.
L&T Daily Chart
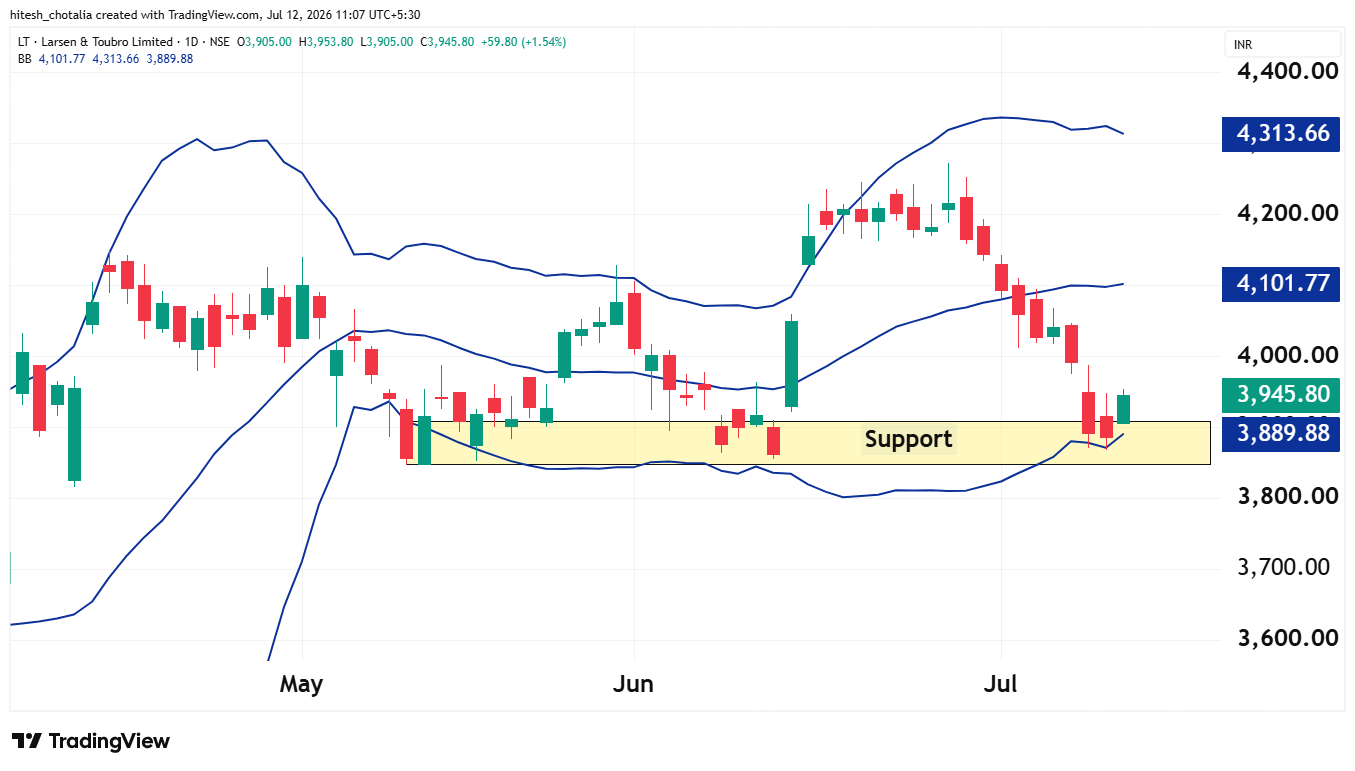
Chart Source: TradingView
11. Infosys: 1,068 (+1.99%)
Prices are seeing a short term pullback.
The pullback will face stiff resistance in the gap area between 1,091 and 1,125.
Support is around 1,055.
A break below 1,055 could see the downswing continue.
Expect strong resistance around the gap area.
Infosys Daily Chart
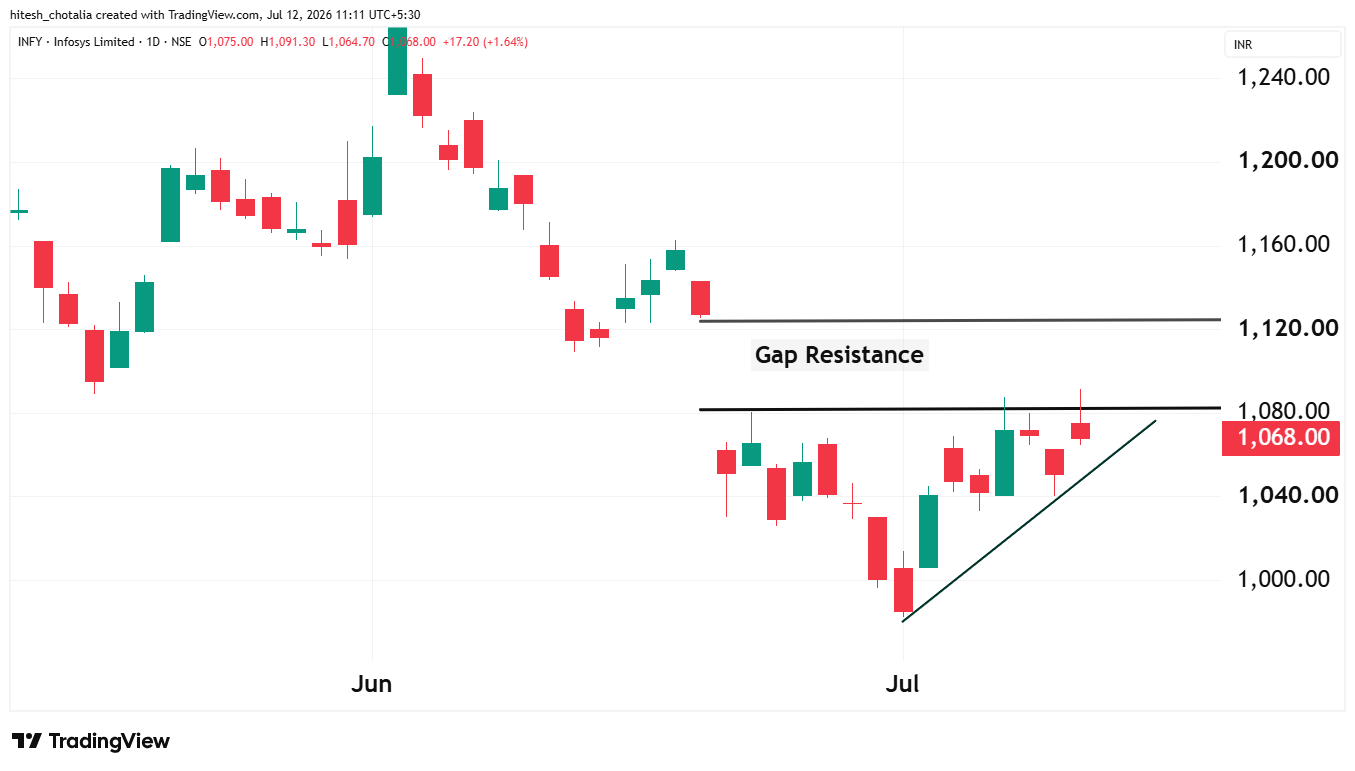
Chart Source: TradingView
Join our daily live pre-market update on YouTube. We provide an educational analysis of Nifty and Bank Nifty every morning, giving you a heads-up before the opening bell.
About the author- Mr. Hitesh Chotalia has over 26 years of experience in the financial markets. He’s worked as a Technical Market Strategist with Sharekhan, Citi Global Markets (Asia Pacific Equity Research), and Centrum Broking.
Disclaimer
Investments in the securities market are subject to market risks, read all the related documents carefully before investing. Brokerage will not exceed the SEBI prescribed limit. | InCred Money Broking Limited : NSE Member Code 09073, BSE Member Code 6329, MCX Member Code : 55215 , NCDEX Member Code : 1233 NSDL : IN-DP-474-2020 . SEBI Registration No. INZ000164738 | Compliance Officer: NSE,BSE,MCX,NCDEX,NSDL : Mr RK Jain , 011-40409999 brokingsupport@incredmoney.com | Registered Office:- 3rd Floor, Building No.5, Local Shopping Complex, Rishabh Vihar, Near Karkarduma Metro Station. East Delhi – 110092
I found this week’s outlook very clear and balanced. The emphasis on respecting NIFTY’s range levels and preparing for both bullish and bearish scenarios is practical and timely. The structured walk-through of global macro events (US jobs, FOMC minutes, China CPI/PPI) adds strong context for traders who follow cross-asset signals.
Overall, it’s a disciplined reminder to size positions carefully and avoid chasing noise. Looking forward to seeing more tactical insights alongside the macro framing in future posts.
Very informative analysis, thank you